There is a pleasing consistency to a result like this: no group actually opposed the 10 Year Capital Plan, they simply differed on how enthusiastically to back it. Yes carried the day by more than two to one, and not a single age bracket dipped below three-in-five support, an unusual show of cross-generational agreement in a category — health — that normally splits sharply on trust in government delivery.
The pattern that stands out is less a fracture than a gradient. The oldest voters, those most likely to have used or watched relatives use crumbling NHS estate, backed the plan without exception, while the youngest cohort was the most equivocal group in the chamber, still voting yes but by a much narrower margin. Men were somewhat more convinced than women, though neither sex came close to rejecting the plan.
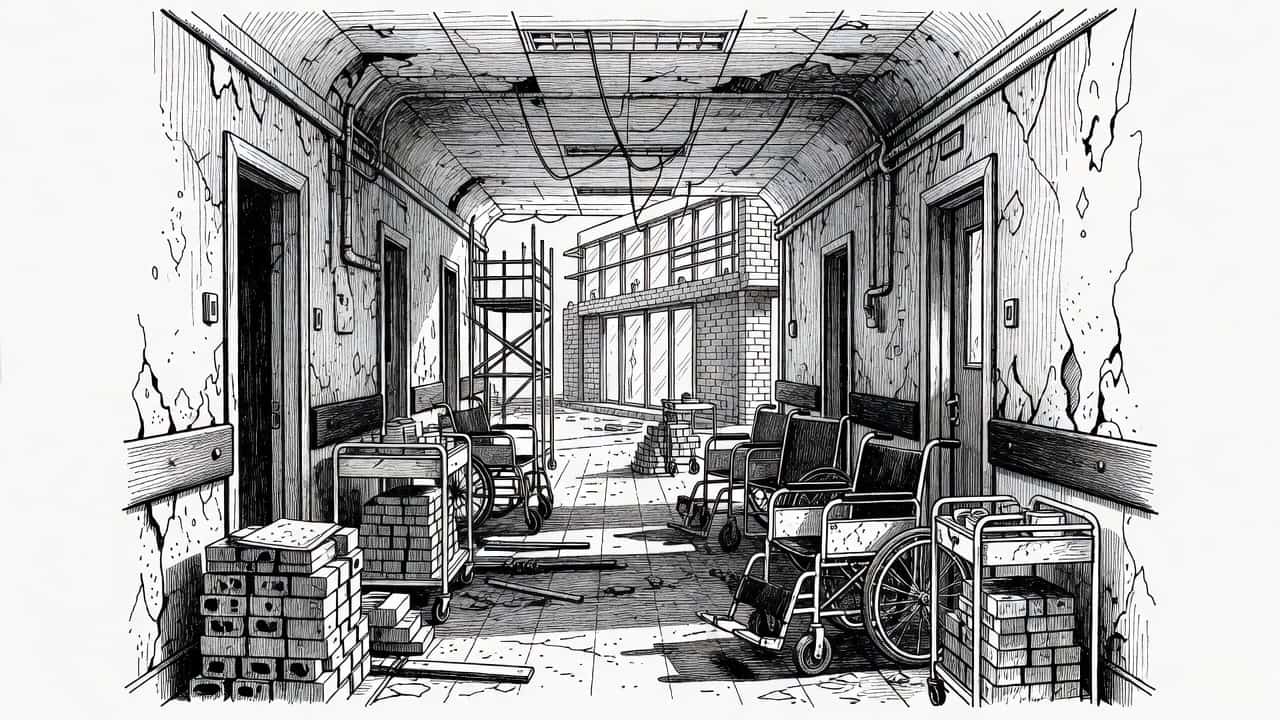
The vote lands against the backdrop of Lord Darzi's diagnosis of a decade of raided capital budgets, and the result reads as an endorsement of the principle of ring-fenced rebuilding over the alternative of quietly continuing to patch day-to-day deficits with money meant for bricks and mortar. Scepticism here was muted rather than absent, concentrated among the working-age middle rather than the old or the very young.
If ministers were hoping for a mandate to finally stop robbing the capital budget to pay the revenue one, this chamber gave them about as clean a version of one as referendums like this produce.




0 Opinions
Weigh in on the debate.